Cloudwatch Container Insight in depth
In our previous article, we learned how to setup cloudwatch container insights for our eks cluster using Fleuntd. In this article, we will learn how to work with log groups and metrics cloudwatch container insights in depth. Let's get started.
Prerequisites
Access to Clouwatch Dashboard
To access cloudwatch dashboard, you need to login to your aws console. Once you are logged in, you can access cloudwatch dashboard by clicking on the cloudwatch icon on the top right corner of the console.
Access to Cloudwatch Container Insights
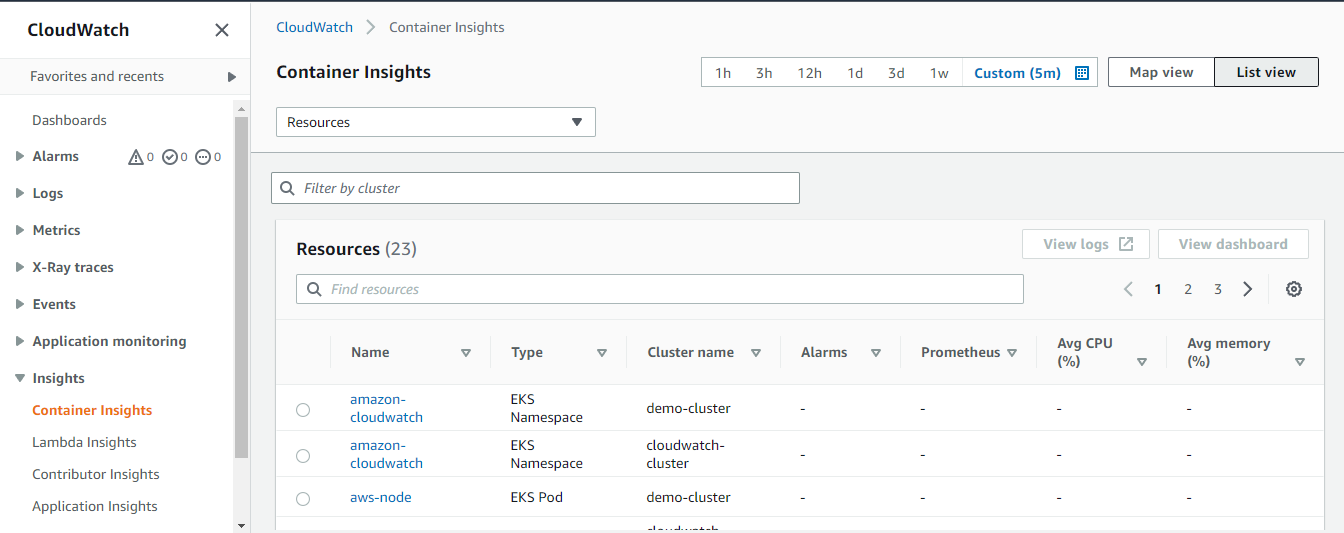
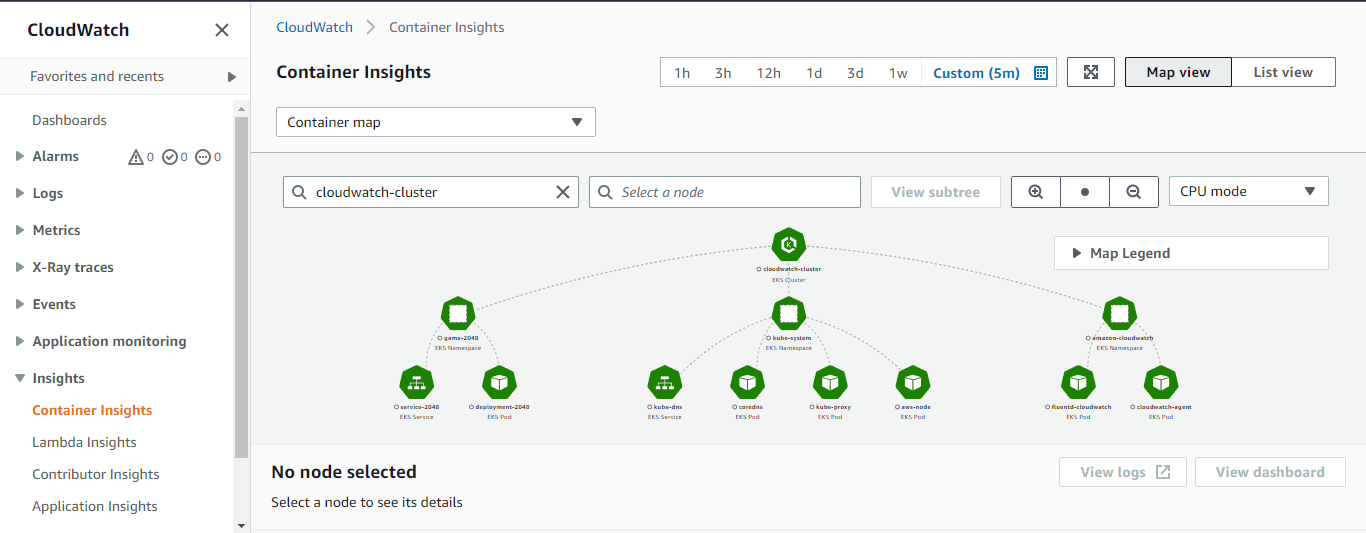
To access cloudwatch container insights, you need to click on the Container Insights option on the left side of the cloudwatch dashboard. When you click on the Container Insights option, you will be redirected to the cloudwatch container insights dashboard. On their you can see all the container resources avaliable for your cloudwatch enabled clusters. In our case, I have two cluster and my container insights dashboard looks like this.
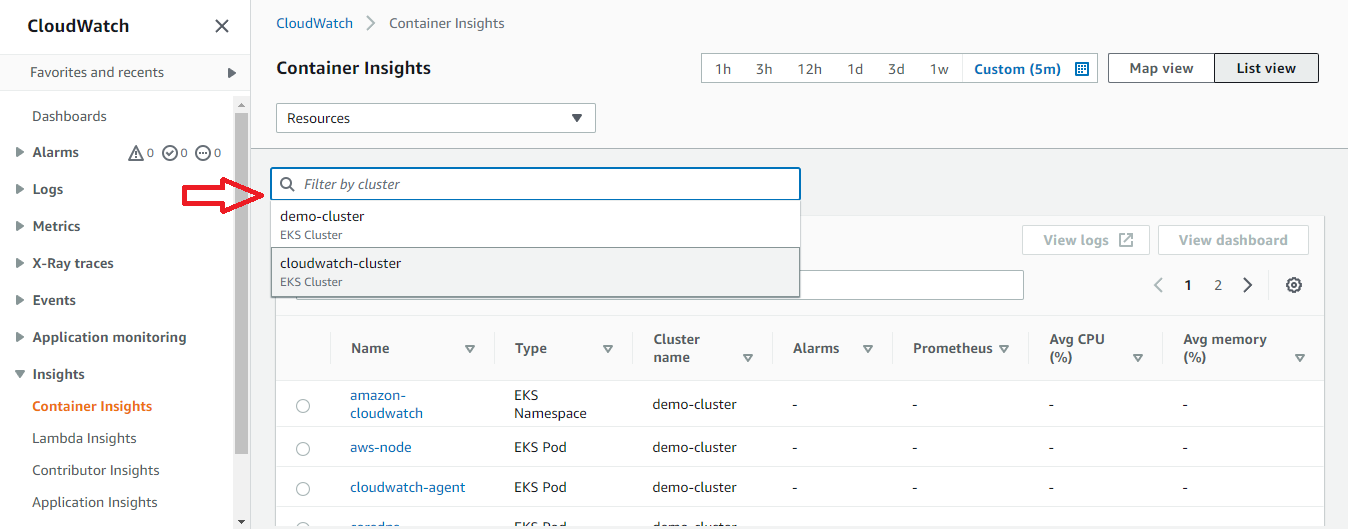
If you need to get resources for a specific cluster, you can select the cluster from the Filter by cluster dropdown
If you need to get map view. You can click on the Map view button on the top right corner of the dashboard.
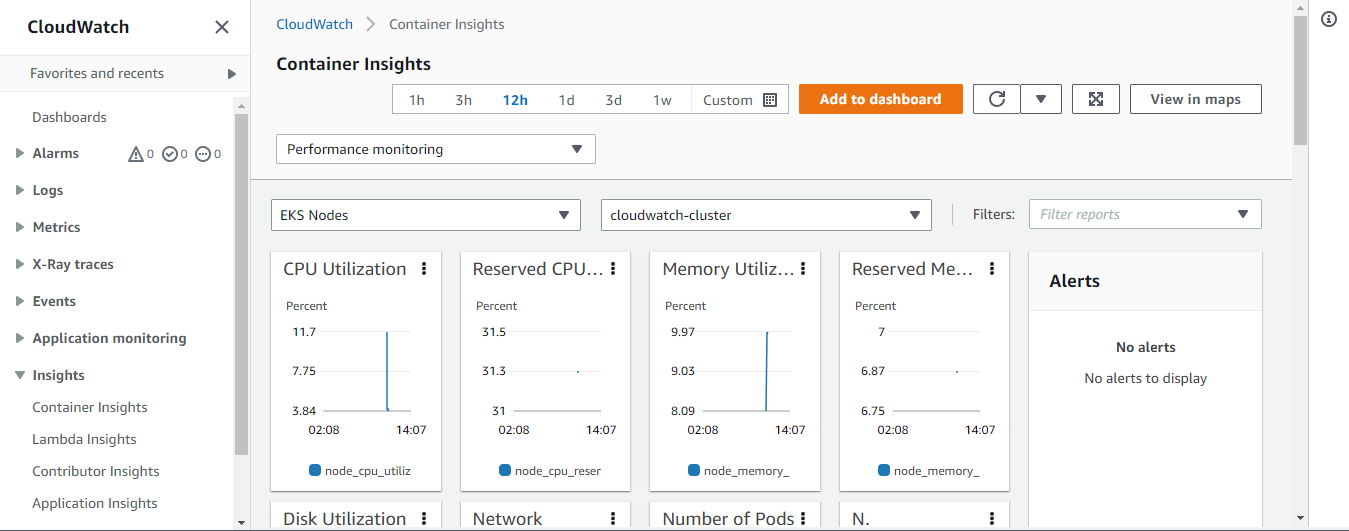
If you need to get performance monitoring. You can click on the Performance monitoring button on the top left corner of the dashboard and choose the cluster and the resource you need to monitor.
Create Custom Dashbaords
It's better to have custom dashboards for your resources becuase it's gives better insights about your resources. Here I have included some sample queires for creating custom dashboards for your resources. You can use these queries to create your own dashboards. You can use Logs Insights section to create your own dashboards by using below queries.
Log group: /aws/containerinsights/
Widget Type: Bar
Query:
1 | STATS avg(node_cpu_utilization) as avg_node_cpu_utilization by NodeName |
Log group: /aws/containerinsights/
Widget Type: Table
Query:
1 | STATS avg(number_of_container_restarts) as avg_number_of_container_restarts by PodName |
Log group: /aws/containerinsights/
Widget Type: Table
Query:
1 | stats avg(cluster_failed_node_count) as CountOfNodeFailures |
Log group: /aws/containerinsights/
Widget Type: Bar
Query:
1 | stats pct(container_cpu_usage_total, 50) as CPUPercMedian by kubernetes.container_name |
Log group: /aws/containerinsights/
Widget Type: Bar
Query:
1 | stats count() as countoferrors by kubernetes.container_name |
Log group: /aws/containerinsights/
Widget Type: Pie
Query:
1 | stats floor(avg(container_filesystem_usage/1024)) as container_filesystem_usage_avg_kb by InstanceId, kubernetes.container_name, device |
You can find more queries here